The Indian tyre industry is a key wheel of the country’s automotive industry, fueled by robust replacement market demand, rising OEM sales, and improved export opportunities. Two of the industry’s top players—CEAT Limited and JK Tyre & Industries Limited—have announced their Q3 FY25 performances, giving us an insight into their financials, growth strategies, and expectations. For long-term value and growth investors, a choice between the two tyre majors is an entry into their financials, market positions, and growth strategies. Here is a comparison of CEAT and JK Tyre on key parameters to determine which stock is a better bet.
Financial Performance
CEAT Limited
Revenue: CEAT has posted standalone revenue of Rs. 3,292 crores in Q3 FY25, a 11.6% year-on-year (YoY) growth driven by a 7.9% volume growth. Consolidated revenue was Rs. 3,300 crores, a 11.4% YoY growth.
EBITDA: Consolidated EBITDA was Rs. 346.3 crores, a 10.5% margin, lower by 64 bps QoQ and 387 bps YoY as raw material cost went up by 1.2%.
Profit After Tax (PAT): Consolidated PAT was Rs. 97 crores, compared to Rs. 181 crores YoY and Rs. 121.45 crores QoQ (the latter assisted by Rs. 16 crores non-operating income).
Debt: Net debt decreased to Rs. 1,835 crores from Rs. 1,885 crores, debt-to-EBITDA was 1.22, and debt-to-equity was 0.43, indicating a robust balance sheet.
Capex: Rs. 283 crores in Q3, full-year guidance of Rs. 1,050 crores funded through internal accruals.
JK Tyre & Industries Limited
Revenue: Consolidated revenue was Rs. 3,694 crores despite last year, with subsidiary Cavendish Industries bringing in Rs. 1,025 crores (a quarter high) and JK Tornel (Mexico) bringing in Rs. 507 crores (1,282 million pesos).
EBITDA: EBITDA stood at Rs. 335 crores, 9.1% margin, down 309 bps QoQ led mainly by a 2% QoQ increase in raw material prices, spearheaded by natural rubber.
Profit After Tax (PAT): PAT of Rs. 57 crores, significantly lower than CEAT, indicating margin squeeze and soft OEM demand.
Debt: Net debt stood at Rs. 4,319 crores, lower than Rs. 4,340 crores, with debt-to-EBITDA at 2.4 and debt-to-equity at 0.89—greater leverage than CEAT.
Capex: Rs. 600 crores spent year-to-date (YTD) out of a Rs. 1,400 crores plan, focused on PCR (Passenger Car Radial) and TBR (Truck Bus Radial) expansions.
Comparison: CEAT beats JK Tyre on revenue growth (11.4% vs. flat), PAT (Rs. 97 crores vs. Rs. 57 crores), and margin resilience (10.5% vs. 9.1%). CEAT’s better debt position and enhanced cash generation from operations (funded by internal accruals) provide it with a financial advantage. JK Tyre is supported by a diversified top-line from subsidiaries, but its higher debt position is a worry.
Market Capitalization: Its Dimensions and Valuation
CEAT Limited:
Standalone market value of CEAT on March 02, 2025, is in the range of Rs. 11,000-12,000 crores (considering a trend and allocating a stable value of Rs. 2,700-3,000 to each share) with its average P/E between 15-18x, thereby demonstrating growth potential at fair valuation.
JK Tyre & Industries Limited:
JK Tyre is worth around Rs. 11,500-12,500 crores at a price of Rs. 440-480 with a lower P/E of 12-14x, which means it is cheaper but with more risk due to debt.
Comparison: Both companies have comparable market caps, but CEAT’s higher premium P/E indicates investors’ faith in its growth path and financial prudence. JK Tyre’s lower valuation may attract value investors, but its leverage blunts enthusiasm.
Order Book and Market Share
CEAT Limited:
Order Book: CEAT does not give a straight order book disclosure but reports good OEM traction (mid-single-digit growth) and double-digit replacement and exports growth (19% of revenue, targeting 26% post-Camso acquisition). Its focus on electric vehicles (25% OEM share) and premium SUVs (17-inch+ fitments) gives a good pipeline.
Market Share: Stable in PCR, rising in TBR (nearly double-digit), and strong in 2-wheelers, especially scooters and rural segments.
JK Tyre & Industries Limited:
Order Book: JK Tyre reports a 16% YoY growth in replacement market (24% in PCR) and maintaining exports (Rs. 560 crores), although modest OEM growth. Its Mexican subsidiary (JK Tornel) focuses on exports to North America (now 5%) with a planned ramp-up.
Market Share: Leading in TBR and PCR, with radial capacity utilization of more than 80%, although individual performance is less notable than in CEAT.
Comparison: CEAT’s expansion in diversified segments of OEM, replacement, and exports, premiumization, and EV concentration indicate a robust order pipeline. JK Tyre has strong replacement but weak OEM momentum.
Growth Strategy: Expansion and Innovation
CEAT Limited:
Key Pillars: Electrification (25% EV OEM share), global business (targeting 26% saliency), premiumization (Secura Lyfe tyre as a case in point), and digital transformation (Chennai plant as a WEF Lighthouse).
Expansion: Brownfield expansions at Chennai (PCR and TBR) and Nagpur (2-wheelers to 100,000 tyres/day), with bite-sized capex of Rs. 1,050 crores per annum. OHT and international revenue will be driven by the acquisition of Camso (May 2025 close).
Innovation: Green tyre focus (5% decrease in rolling resistance) and high-performance SUV fitments (e.g., Mahindra Thar Roxx).
JK Tyre & Industries Limited:
Key Pillars: Premiumization (progressively larger rim sizes in Mexico), radial capacity growth (PCR and TBR), and sustainability (adherence to RE100, IFC sustainability-linked loan).
Expansion: Rs. 1,400 crores capex for PCR (Banmore) and TBR (Laksar) with Rs. 800 crores per annum spend. JK Tornel is aiming export growth in North America and Latin America.
Innovation: Technology-enabled manufacturing for efficiency and Digital and Analytics Centre of Excellence.
Comparison: CEAT’s is a more aggressive and diversified approach with a clear EV and international push backed by the Camso acquisition. JK Tyre’s approach is good but very dependent on radial growth and lacks CEAT’s EV benefit.
Future Prospects: Demand and Margins
CEAT Limited:
Demand: Expects double-digit growth in 2-wheelers and TBR, low single-digit in PCR and farm tyres, with rural demand (40%-50% higher growth) and exports taking the lead.
Margins: Targets 14% EBITDA recovery over 6-9 months when raw materials level out and price hikes (1%-4% across segments) take effect.
Tailwinds: Investments in rural infrastructure, US market expansion, and Camso synergies.
JK Tyre & Industries Limited:
Demand: Expects TBR and PCR to be key substitute growth drivers while anticipating OEM bounce back to occur in Q4 FY25. Benefiting from peso weakening, expects exports to grow through Mexico.
Margins: Aims for 12%-15% EBITDA in FY26, with the assumption of stable raw material prices and recovery of under-recovered costs (4%-5%).
Tailwinds: Mexico’s infrastructure expenditure, premiumization, and export opportunities.
Comparison: CEAT is more optimistic, with broader drivers of growth and a faster recovery time horizon for margins. JK Tyre’s revival is subject to OEM normalization and raw material stability.
Challenges: Headwinds to Watch
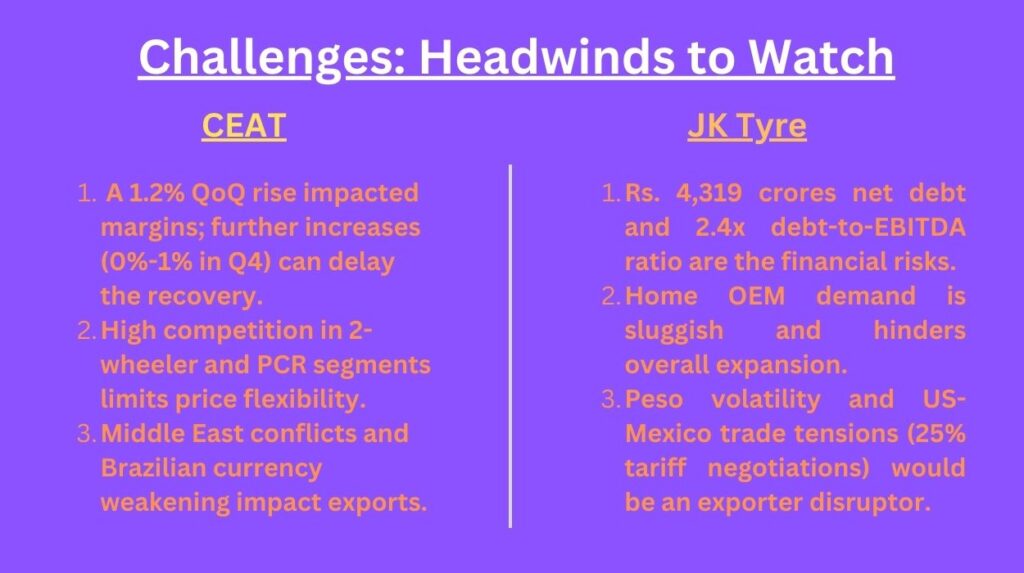
CEAT Limited:
Raw Material Costs: A 1.2% QoQ rise impacted margins; further increases (0%-1% in Q4) can delay the recovery.
Competition: High competition in 2-wheeler and PCR segments limits price flexibility.
Geopolitical Risks: Middle East conflicts and Brazilian currency weakening impact exports.
JK Tyre & Industries Limited:
High Debt: Rs. 4,319 crores net debt and 2.4x debt-to-EBITDA ratio are the financial risks.
OEM Slowness: Home OEM demand is sluggish and hinders overall expansion.
Mexico Risks: Peso volatility and US-Mexico trade tensions (25% tariff negotiations) would be an exporter disruptor.
Comparison: With its strong balance sheet, the problems of CEAT are comprehensible, whereas the high leverages and reliance on OEM at JK Tyre are riskier.
Final Verdict: CEAT Limited Edges Ahead
For long-term investors, CEAT Limited is the better bet.
Why?
Financial Strength: Greater revenue growth, improved margins (10.5% vs. 9.1%), and improved balance sheet (debt-to-EBITDA 1.22 vs. 2.4) make CEAT more robust.
Growth Path: CEAT’s electrification theme, global expansion (Camso), and premiumization track future mobility themes, offering diversified upside.
Risk Management: Reduced debt and stable capex funding through internal accruals decrease financial risk over JK Tyre’s leverage.
Valuation: Slightly pricier (P/E 15-18x vs 12-14x), but CEAT’s growth prospects justify the premium. JK Tyre remains a compelling value play with its dominance of the replacement space and its radial bias, but its high gearing and tepid OEM take-up moderate its appeal for stability over the longer term.
Growth investors looking for moderate risk can opt for CEAT, whereas risk-starved investors who are comfortable taking greater risk for potential value unlocking can choose JK Tyre.